
Archive·tidytraces.com
15 Stories

AI Observability Daily · Observability · Evals · AI agents


A date-verified edition of AI observability: original Hacker News announcements and practitioner posts, official publisher news, and GitHub releases covering traces, evaluations, and telemetry reliability.

Coverage window: 2026-10-12 · Original sources, independent editorial takeaways.

Section
Signal

No stories match the selected filters in this edition.

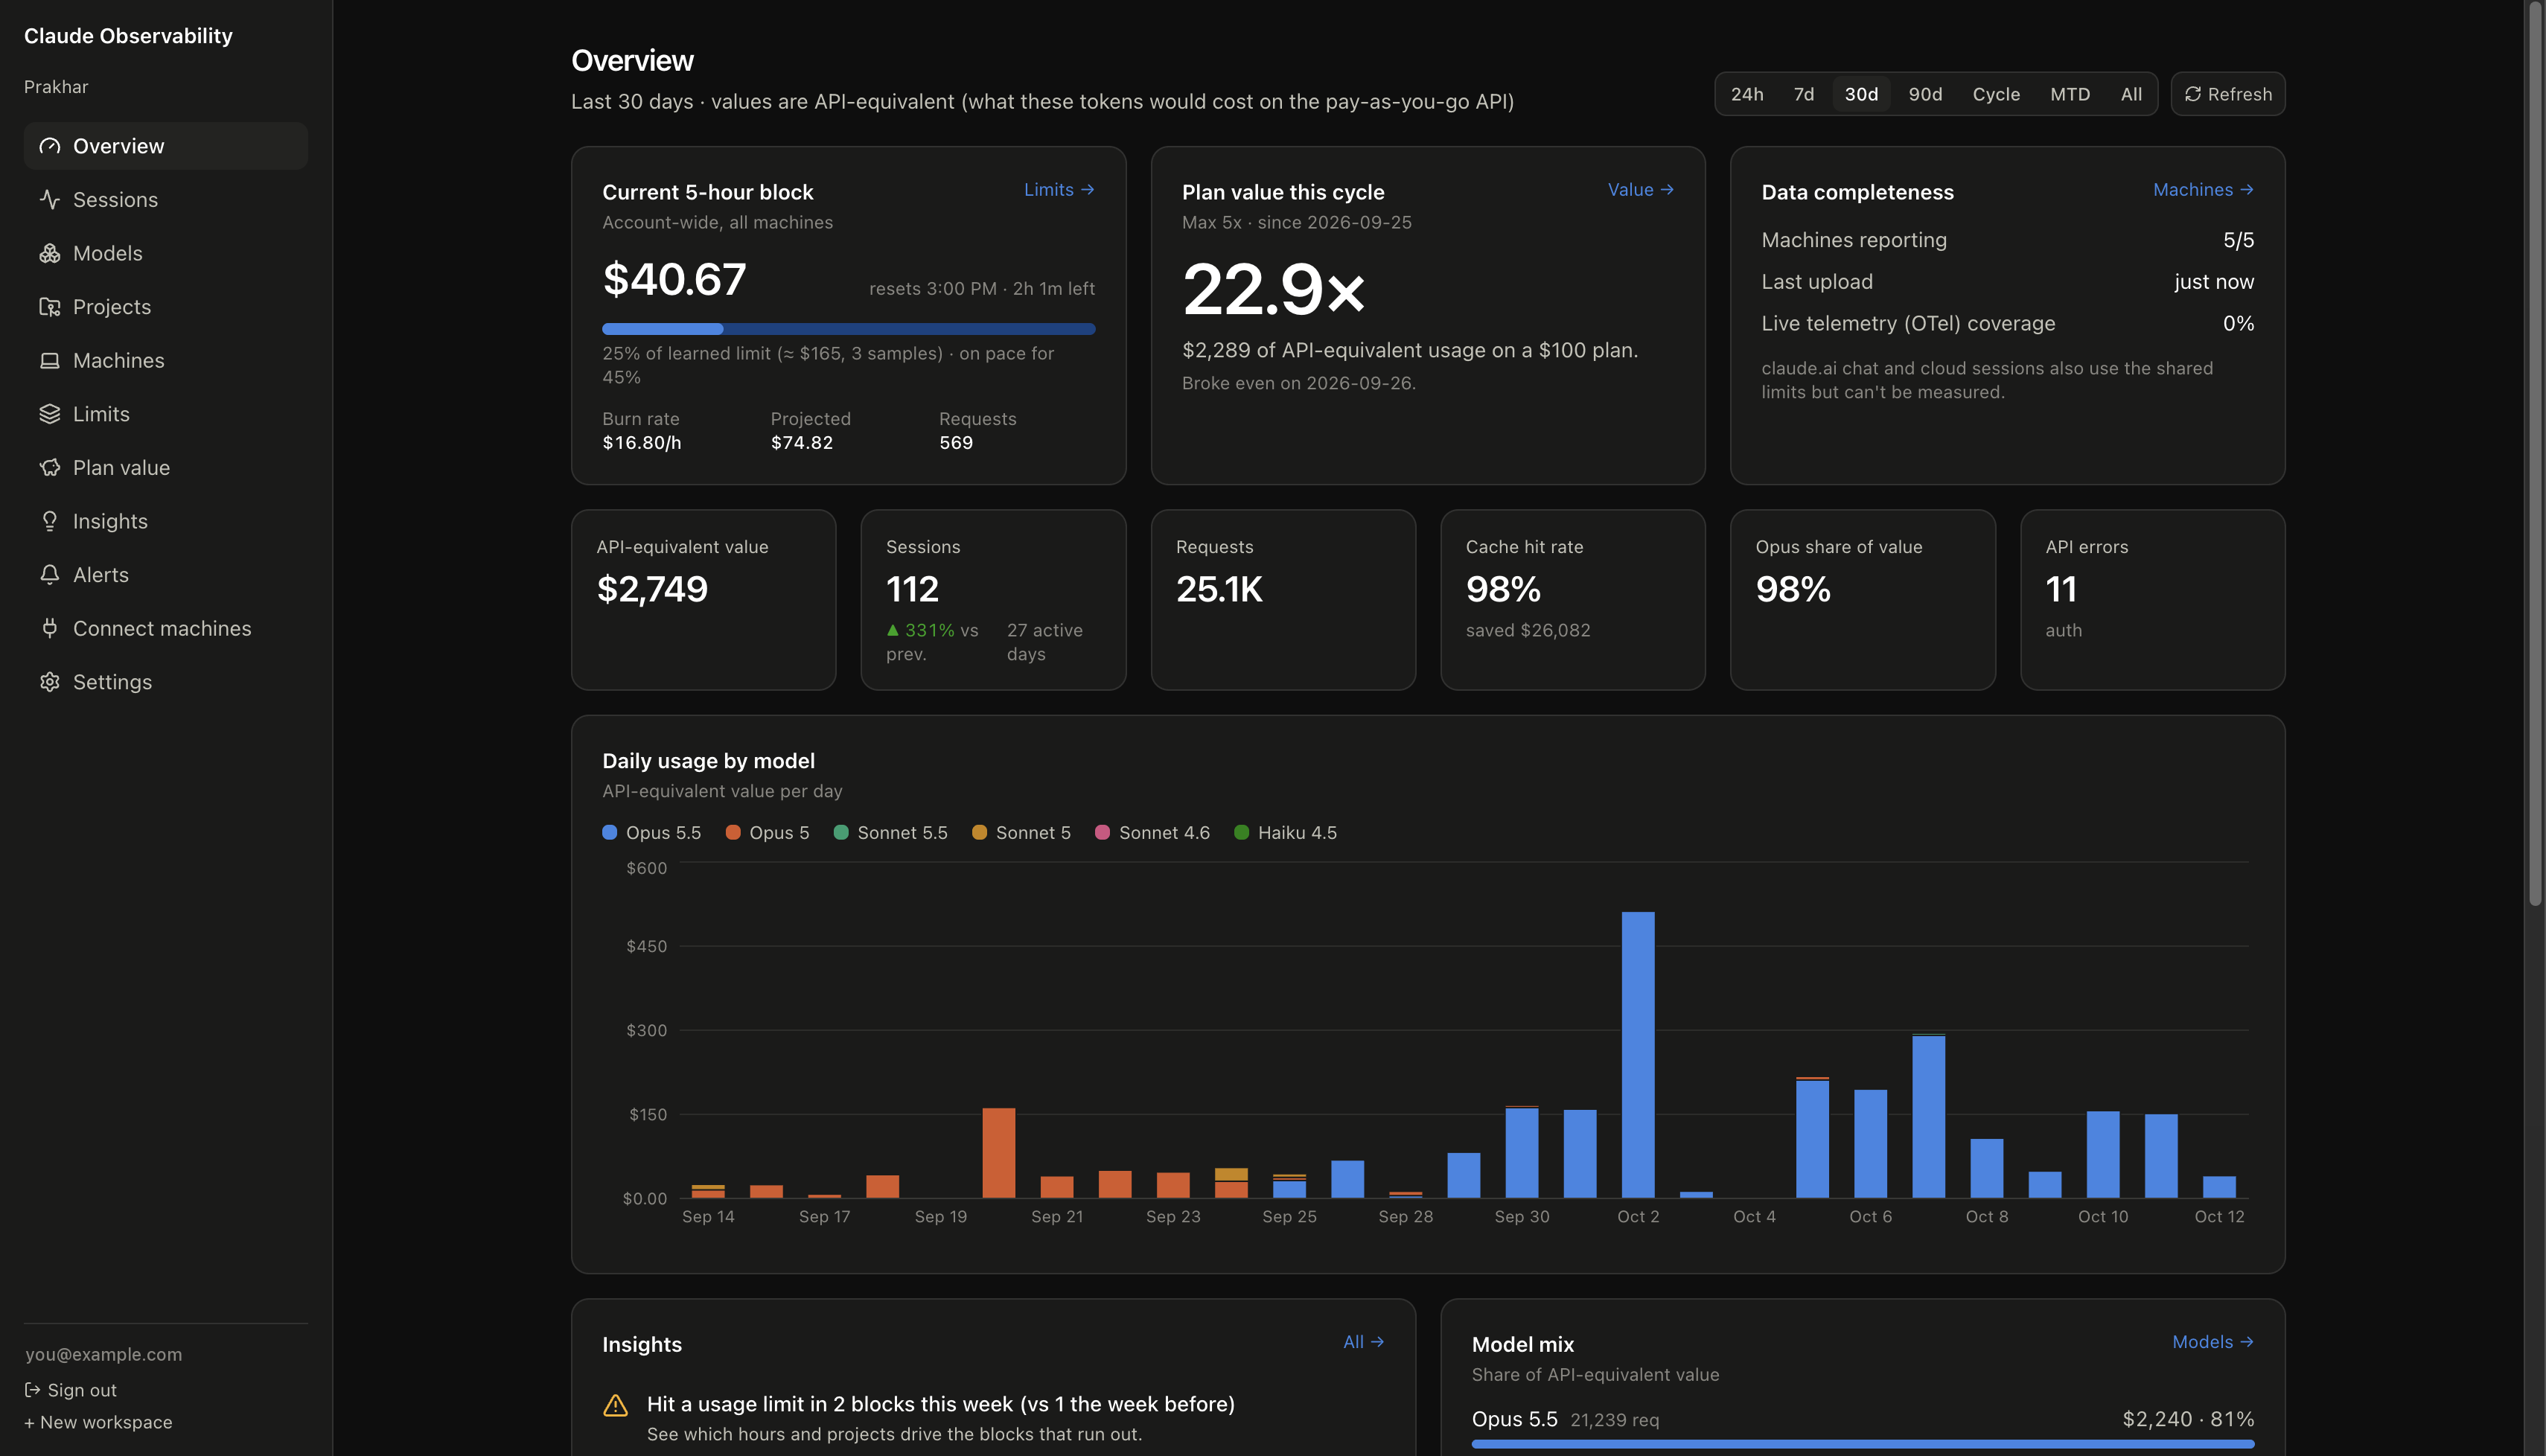
A Claude subscription dashboard turns local session files into account-level observability

Source image · Prakhar Gurunani

Gurunani describes a collector and dashboard that combine Claude Code usage across machines. The article focuses on deduplicated ingestion, missing-machine detection, local data minimization, and the limits of telemetry extracted from undocumented session files. Its cost comparisons are API-equivalent usage estimates, not a subscription invoice.

Why it matters Useful agent analytics need coverage checks and privacy controls alongside usage totals. Treat this as a practitioner implementation, not an official Anthropic reporting API.

In a first-party Show HN announcement, Airlock’s developer describes running coding agents inside a macOS virtual machine and showing what commands ran and what changed before returning changes to a project. The post also describes restricting network destinations. These are the developer’s claims; this issue does not independently benchmark the isolation.

Why it matters Command and change visibility can complement agent traces when investigating workstation side effects. Isolation controls and complete telemetry are separate questions.

The October 12 release notes include measurement of score persistence outcomes, extraction of inline media from raw OpenTelemetry documents, and changes to evaluation and ingestion operations. The release bundles many other changes; these items are the subset relevant to AI observability.

Why it matters An evaluator result is not useful operationally if it never reaches durable storage. When upgrading, verify score persistence and trace ingestion with a small end-to-end canary.

Phoenix’s October 12 patch release lists a span ingestion reliability fix and support for empty dataframes in TraceDataset. The notes do not quantify a throughput or loss-rate improvement, so this issue makes no performance claim.

Why it matters Missing spans undermine every downstream evaluation and incident analysis. Operators should check this patch against their ingestion path and validate telemetry delivery after upgrading.

Dynatrace announced general availability of its Snowflake observability integration, bringing data-pipeline health, warehouse performance, usage/cost, and related telemetry into the same operational view. The announcement is particularly relevant where analytics and AI workloads depend on fresh, reliable warehouse data.

Why it matters For AI products, the model trace is only part of the path: warehouse freshness, query performance, and spend can become user-facing reliability problems too.

Dynatrace announced an initial implementation milestone toward FedRAMP High authorization. This is a compliance and public-sector availability update for the observability platform—not a new telemetry or AI-evaluation feature.

Why it matters For teams serving U.S. federal workloads, authorization milestones affect procurement and deployment options; the announcement should not be read as a blanket authorization of every service or deployment.

Elastic describes using anomaly detection over Kubernetes node-pressure signals to surface resource stress ahead of visible workload symptoms. The post reports a controlled test, not a universal production guarantee, and the result varied across runs.

Why it matters Treat early-warning detection as a hypothesis to validate against your own workload and alert precision—not as a fixed lead-time promise.

AWS announced a CloudWatch Insights dashboard for node-based Valkey clusters. It uses ElastiCache-published OpenTelemetry metrics, and detailed monitoring can publish metrics every 15 seconds; the underlying CloudWatch metrics are billable.

Why it matters This adds a managed health view, but teams should check the monitoring level and metric charges before treating it as a free or exhaustive observability layer.

The Explore release notes list changes for October 12 including ways to move between logs and spans across datasets and switch between query-building modes. This is a product-surface update rather than a standalone engineering blog post.

Why it matters Fewer context switches can speed investigation, but teams should still verify that the selected datasets preserve the trace/log correlation they depend on.

The Metrics release notes clarify that when a rule reaches its cardinality limit, overflow label values are aggregated under `CoralogixOtherValues`; the documentation change does not describe dropping all subsequent measurements. It also documents the organization-level quota behavior for new or edited rules.

Why it matters That distinction matters during incident diagnosis: an overflow bucket signals cardinality pressure, but it is not the same failure mode as ingestion stopping.

Google SecOps release notes list the Response Health Hub on October 12, giving operators a place to inspect response/playbook health and related operational signals. This is security-automation operations visibility, adjacent to core infrastructure observability.

Why it matters As agents and automated playbooks take action, teams need a way to observe the health of the response workflow—not only the infrastructure underneath it.

Agent Data Services entered private preview as a managed catalog for multimodal content, structured records, and agent sessions. The announcement describes capturing execution traces and feeding session state into retrieval and evaluation workflows over time.

Why it matters It treats agent histories as durable operational data, though private preview is not a generally available service and its capabilities need hands-on validation.

Splunk's post connects agent behavior and tool-call visibility with security controls, arguing that an agent can complete a technically valid action while still producing an unacceptable business outcome. It positions runtime observation alongside prevention and policy enforcement.

Why it matters Operational success needs more than uptime and latency: teams need to inspect what the agent decided, what tools it used, and whether the outcome was acceptable.

Splunk's engineering post makes the case that infrastructure generated with coding agents remains production infrastructure: it still needs testing, ownership, security controls, and telemetry after deployment. The useful shift is to treat generated changes as software changes, not as disposable prompts.

Why it matters If an agent can create or modify infrastructure, observability and change accountability need to cover the generated artifacts and their runtime effects.

Elastic announced shared conversations in Agent Builder so teams can hand an agent session to colleagues with its prior context intact. The article describes availability on Elastic Cloud Serverless first, with other deployment options on a separate rollout path.

Why it matters This is useful for investigation handoffs, but shared conversation history is not a substitute for trace-level observability or audit evidence.

Editorial method and sources

Only items published on 2026-10-12 qualify. Summaries distinguish source claims from independent editorial takeaways. If nothing qualifies, the issue stays empty. Generated infographics are labelled as editorial illustrations; source images retain their attribution.

Original source links and publication dates appear with every story. Source tabs classify discovery channels, while the topic remains AI observability. Recommended means a recorded signal score of at least 8; Must-Read means at least 9. Unrated stories appear only under All.